What Signal finds in real operating data.
Most restaurants already have POS dashboards. Signal finds the patterns hidden between them—where revenue leaks, discounts cluster, and labor gets desynchronized.
Happy Hour Margin Compression
Promotional appetizer volume cannibalizes regular dinner entree margin while food sales volume increases.
Unlinked Promo Buttons & Comps
Generic discount keys applied without manager rules, causing comp spikes at shift handoffs and station 3.
Modifier Omissions & Add-ons
High ticket pace leads staff to type special requests into kitchen notes instead of ringing billable modifier buttons.
Friday & Saturday Kitchen Backups
Ticket queue delays peak 30 minutes before labor additions, driving overtime and stretched table turn times.
Station Imbalances & Wait Friction
Appetizer/sauté stations hit maximum ticket load while grill sits idle, creating erratic pacing on guest checks.
Post-Fire Void Cascades
Voids occurring after orders are already sent to kitchen displays, masking waste as simple guest cancellations.
See all analysis categories & cross-report methodology
The Six Operational Intersections Signal Examines
POS systems keep your reports in separate silos. Signal pulls them into an integrated model to reveal what is happening between the lines:
Identifies when labor is scheduled against peak guest arrivals versus when the kitchen actually gets backed up.
Detects shift transitions where understaffed floor stations generate elevated mistake voids and comped drinks.
Uncovers promotional rules where percentage discounts give away more margin than fixed-dollar offers on high-top tables.
Measures table dwell times against kitchen ticket queues to show where kitchen delays suppress profitable turn volume.
Flags complex modifier items that overwhelm cook stations during rushes and cause kitchen-wide slowdowns.
Correlates station ticket volume with server-entered apology comps to isolate station-specific operational breakdowns.
One clear report. Ranked by what is at stake.
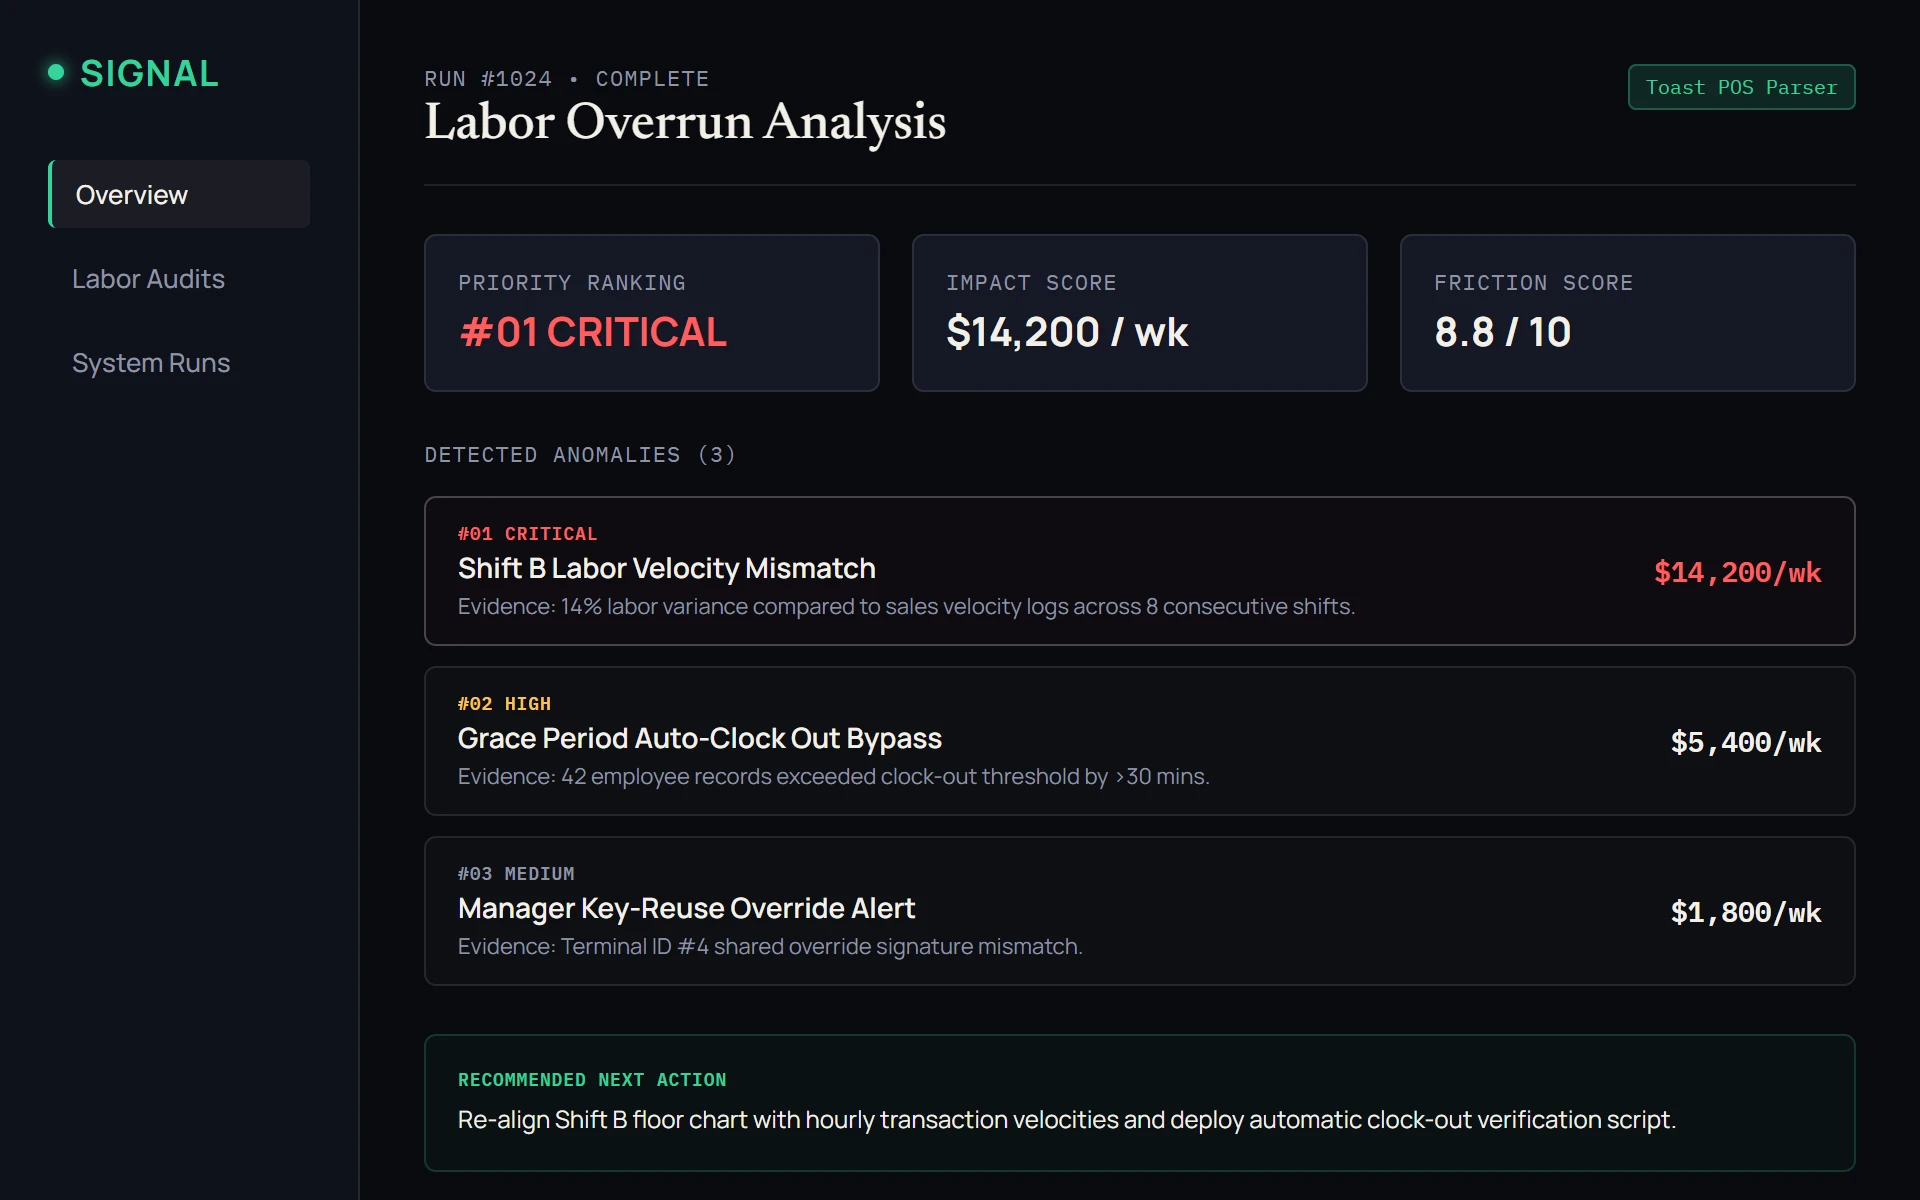
Signal separates facts from assumptions, calculates exact dollar impact, and provides a floor-validation check for every finding. Explore the synthetic sample findings below:
Multi-Source Operational Synthesis
Cross-analysis across sales, labor, discounts, and modifier omissions in a single prioritized brief.
The 10% promotion is giving away more than the $5 offer
Promotional appetizer volume cannibalizes dinner entree checks on high-top tables.
| Check Size | 10% Discount | $5 Promo Offer | Difference | Annualized Leakage |
|---|---|---|---|---|
| $42.00 (2-top) | $4.20 | $5.00 | +$0.80 margin | — |
| $88.00 (4-top) | $8.80 | $5.00 | -$3.80 leak | $1,976/yr |
| $145.00 (6-top) | $14.50 | $5.00 | -$9.50 leak | $2,224/yr |
Cap the 10% promo button at a maximum $6 discount, or switch the campaign to a fixed $5 appetizer credit to eliminate margin bleed on parties of 4+.
Unlinked Promo Buttons & Shift Comps
Floor staff use generic discount keys when buttons lack strict POS validation rules.
- 42 checks used open "VIP/Promo" button without required manager authorization code.
- Comp frequency surges 3.4x between 2:45 PM and 3:30 PM (shift transition window).
- Station 3 accounts for 68% of all discretionary food voids during Friday dinner service.
Check POS permissions for open discount keys. Require reason codes on discounts over $10. Review 3 PM shift change drawer counts.
Friday & Saturday Dinner Kitchen Backups
Ticket queue delays peak 30 minutes before kitchen labor additions arrive on shift.
Dinner orders surge at 6:15 PM, but the second line cook is scheduled at 6:45 PM. The resulting 30-minute order backlog cascades through 8:30 PM, forcing late shift stays and kitchen overtime averaging $3,500 over 12 weeks.
Advance Friday/Saturday line cook clock-in from 6:45 PM to 6:00 PM. Shift prep tasks 45 minutes earlier to absorb the initial wave.
How the data gets to Signal.
No direct POS integration, administrative credentials, or system passwords required. You send exported files; Signal analyzes them.
Pull Standard Reports
Download your normal item sales, PMIX, shift labor, or discount summary from Toast, Square, Clover, or your POS.
Send Raw Files
Upload spreadsheets or CSVs through our secure intake form or email them. No credentials or passwords shared.
Receive Prioritized Brief
Get a clear brief ranking verified dollar leaks, modeled opportunities, and concrete floor checks to test immediately.
What files can I send? (Supported formats & POS systems)
Toast, Square, Clover, Lightspeed, Revel, Aloha, Micros, NCR, TouchBistro, and any system capable of exporting tabular reports.
Toast Export Instructions (CSV) →CSV (.csv), Excel (.xlsx, .xls), Tab-delimited (.tsv, .txt), and raw tabular PDF exports. Multi-location and multi-sheet workbooks accepted.
Item Sales Summary, Product Mix (PMIX), Shift Labor / Timecard Details, Comp & Discount Summary, and Hourly Sales by Category (30–90 day range recommended).
What you actually receive.
Every Signal report is built on four distinct epistemological layers so you always know what is verified fact versus modeled hypothesis.
FINDINGS
What is happening. Plain-language operational findings that cut through the fog. We identify exactly where revenue is leaking, where shifts are desynchronized, and which promotions are eroding margin.
EVIDENCE
Where it appears in your data. Exact dollar amounts, verified floor calculations, and timestamped ticket logs. We show you the specific records and math behind every claim—no black-box assertions.
ACTION PLAN
What you can actually change. Concrete, tested recommendations you can implement this week: POS button updates, modifier rules, floor validation checklists, and shift pacing adjustments.
See everything included in your analysis & tier comparison
Complete Deliverables Package
Concise 3–5 page dossier outlining prioritized findings, ranked dollar loss estimates, and floor validation protocols.
Physical observational checklist for shift managers to verify whether modeled ticket lags match kitchen line reality.
Exact menu configuration changes (button restrictions, modifier prompts, comp permission levels) to close leaks.
Capability Progression by Tier
| Capability | Snapshot ($195) | Diagnostic ($595) | Deep Dive ($1,250+) | Ongoing ($249/mo) |
|---|---|---|---|---|
| Core Objective | One specific question | Multi-source discovery | Root cause isolation | Progress tracking |
| Turnaround | 1–2 business days | 3–5 business days | 7–10 business days | Monthly cadence |
| Cross-Analysis | 1–2 reports | Full POS + labor mix | Multi-month trend files | Month-over-month deltas |
| Deliverable | Focused finding memo | Prioritized action dossier | Comprehensive audit report | Monthly progress brief |
Transparent Diagnostic Offers
Signal is currently working with a limited number of restaurant operators while we refine the reporting process with real-world operating data. These introductory rates apply during the pilot period and may adjust as capacity fills.
Signal Snapshot
“You have one question. We dig into it.” A focused operational review investigating a single defined problem.
- 1 defined operational question
- 1–2 business day turnaround
- Verified dollar floor calculation
- 1 in-store floor check protocol
Signal Diagnostic
“You give us the operating data. We find the things you may not know to ask about.” Comprehensive multi-source discovery.
- Full multi-report cross-analysis
- 3–5 business day turnaround
- Prioritized finding brief ranked by $
- Hypothesis testing & floor validation
Signal Deep Dive
“We already know something is wrong. Now we figure out why.” Multi-month root-cause isolation.
- Multi-month trend decomposition
- 7–10 business day turnaround
- Scenario modeling & root cause isolation
- Direct executive debrief call
Ongoing Review
“We compare the new numbers with the old ones.” Re-analyzes monthly data to verify fixes held.
- Monthly progress delta report
- Verification whether fixes held
- Regression & new issue alerts
- Requires prior Diagnostic or Deep Dive
For a small number of restaurants, Signal may provide an agreed report at no charge in exchange for access to useful real-world operating data and feedback on the report. Restaurants can provide exported reports or files directly. If preferred, Signal can also work from temporary, restricted export-only access to the relevant system. Ongoing access, administrative access, or unrestricted account access is not required.
See if your restaurant qualifies for a Data Partnership →Not sure which option fits? Tell me what POS you use.
Send a quick note describing your current setup, and I'll confirm what reports are needed and which analysis makes sense.
Common questions from restaurant operators.
Clear answers about data requirements, turnaround times, and report deliverables.
What data do you need?
Do I need to clean my exports before sending?
Do you need direct access to my POS or administrative passwords?
What file types can I send?
Can you work with Toast, Square, Clover, etc.?
What happens to my data and privacy?
How long does the analysis take?
What if my exports are messy, fragmented, or missing dates?
What exactly will I receive in the final deliverable?
How does upgrading between tiers work?
Ready to see where the money is actually going?
Send your raw POS and labor exports. No system integration or passwords required. Receive a clear, prioritized action list.